


HSY measured air quality at Katajanokka harbour last year – air quality was mostly good
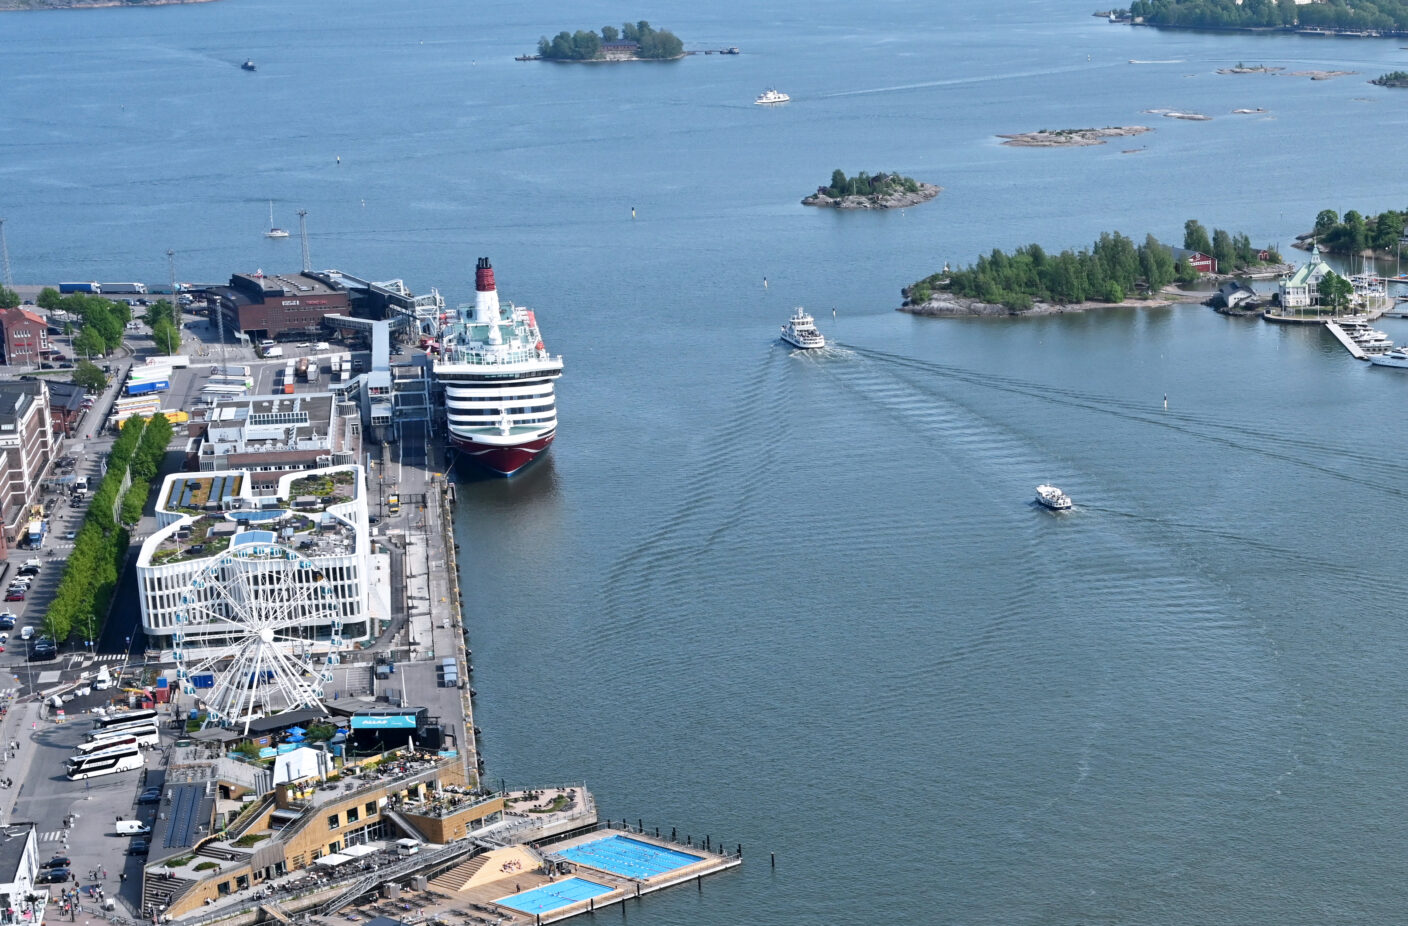
Helsinki Region Environmental Services Authority (HSY) measured air quality at Katajanokka harbour in 2025. HSY has monitored air quality in the harbours of Katajanokka, West Harbour, South Harbour and Vuosaari since 2009. The measurements at Katajanokka also show that air pollutant concentrations in the harbours are low and that the limit values set for air pollutants have not been exceeded. Ship arrival and departure times are reflected in the daily variation of concentrations.
Low air pollutant levels in harbours
Air pollutant concentrations in the South Harbour at Katajanokka in 2025 were low compared to busy traffic areas in Helsinki. The harbours are located in well‑ventilated areas, and emissions are efficiently diluted in open environments. In addition to ship emissions, other traffic within the harbour area also affects air quality.
Emissions from both maritime traffic and road traffic in harbour areas have clearly decreased over about 20 years. The limit values for air pollutant concentrations have not been exceeded.
– In particular, sulphur dioxide concentrations have clearly declined since emission standards for shipping were tightened in 2010 and 2015. In addition, measurements show that sulphur dioxide emissions from energy production in the Helsinki metropolitan area have decreased significantly. Today, concentrations are close to zero, says HSY air quality specialist Saija Korhonen.
Nitrogen dioxide from exhaust gases has halved in harbours
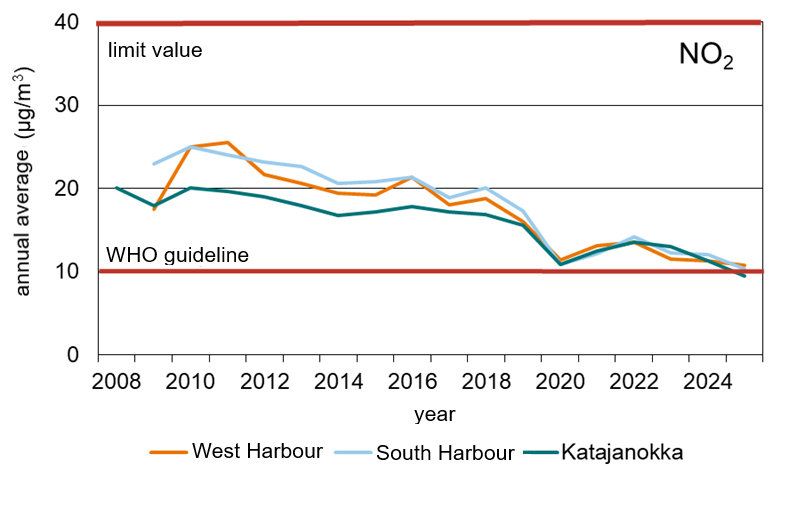
In addition to the mobile air quality monitoring station, nitrogen dioxide concentrations from exhaust gases are monitored annually using small passive samplers in West Harbour, at South Harbour and in Katajanokka. These measurements have been carried out for nearly 20 years. During this time, nitrogen dioxide concentrations have halved in Helsinki’s harbours. The decrease is due to renewal of the vehicle fleet, cleaner exhaust emissions and reduced emissions from shipping.
– In previous years, annual average nitrogen dioxide concentrations still exceeded the World Health Organization (WHO) guideline value, but in 2025 the concentrations measured in Katajanokka already fell below this strict annual guideline, says Korhonen.
– At the port, we are building the conditions needed for the clean transition of logistics and maritime transport. We are preparing for the electrification of transport and for the distribution of alternative fuels, including methanol, says Andreas Slotte, Head of HSEQ and Sustainability at the Port of Helsinki.
– Emissions in harbour areas have decreased significantly over the long term, and there are certainly several reasons for the positive development: lower sulphur content in fuels, improved engine technology and electrification of the vehicle fleet. I believe the results also reflect that in recent years we have started providing shore power to vessels in several parts of the port. Using shore power can reduce a ship’s air emissions by up to 80% while at berth, Slotte continues.
Ship arrival and departure times affect daily variation
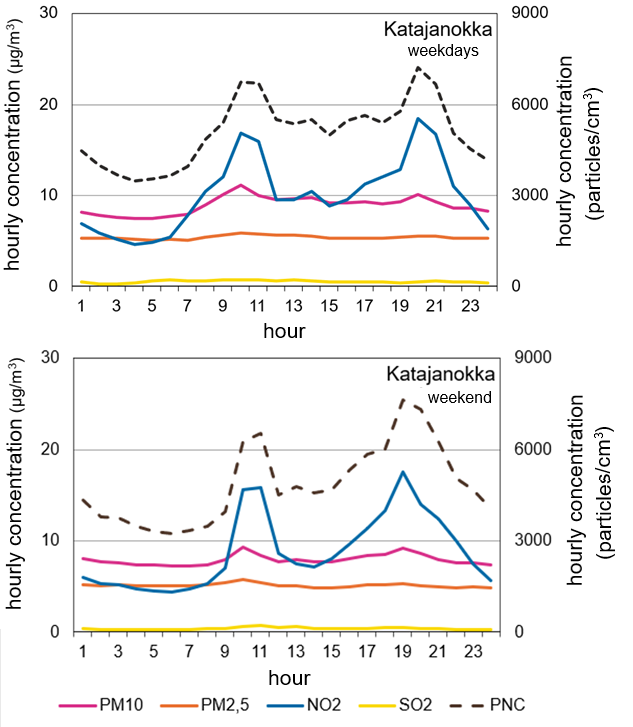
Air pollutant concentrations measured in harbours vary according to ship arrival and departure times. In Katajanokka, increases in nitrogen dioxide from exhaust gases and in particle number concentrations are clearly observed in the morning and evening.
– The concentrations clearly show when ships arrive at and depart from the harbour. Levels vary according to the rhythm of incoming and outgoing traffic. The same variation is seen on weekdays and at weekends, says Korhonen.
About air pollutants
- Sulphur dioxide (SO₂) in outdoor air mainly originates from energy production, shipping emissions and oil refining. Emissions have decreased significantly over recent decades, and current levels are very low.
- Nitrogen oxides in ambient air come from traffic emissions, especially diesel vehicles and heavy traffic. Near harbours, shipping emissions also increase concentrations. Nitrogen dioxide (NO₂) is the most harmful, causing airway constriction and respiratory symptoms, especially in children and asthmatics.
- Inhalable particles (PM10) mainly consist of road dust resuspended by traffic and can be harmful to health. Elevated levels particularly affect people with respiratory diseases.
- Fine particles (PM2.5) are mainly produced by traffic and wood burning and also transported over long distances. They are especially harmful because they can penetrate deep into the lungs.
- Particle number concentration (PNC) is measured in addition to mass concentration. In urban air it effectively describes ultrafine particles from exhausts near sources, which can reach deep into the respiratory system. Main sources include vehicles, machinery, and maritime and air traffic.
- Limit values define the maximum acceptable health‑based concentrations. If exceeded, municipalities must prepare and implement air quality plans.
- The World Health Organization (WHO) provides health‑based guideline values. These are recommendations based on known health impacts.
More information:
- Concentration trends: hsy.fi/concentrationtrends
- Emission trends: Air pollution emission trends in the Helsinki metropolitan area – HSY
- Open air quality data Air pollutant concentrations in the Helsinki metropolitan area – HSY